PowerPoint VBAによるグラフィックス描画の例
関数の表示
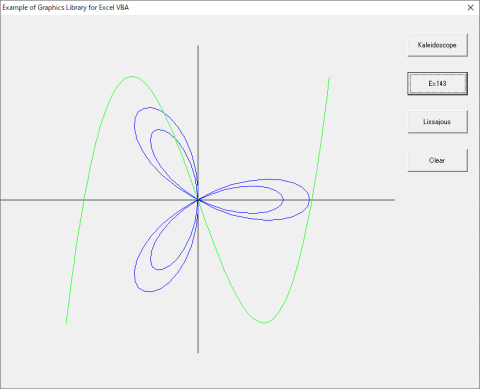
田辺・平山著「実践Fortran95プログラミング」 p.136のGnuplot用の例題をPowerPoint VBAによるグラフィックス描画用に改変した例を示します。
Sub Draw_Function()

  Const Pi = 3.14159265358979
  Dim T, R, x1, y1, x2, y2
  Dim i As Integer

  monhdc = GetForegroundWindow()
  myhdc = GetDC(monhdc)
  If myhdc = 0 Then Exit Sub

  InitializeGraphics
  SetGraphicsWindow -3, 3, 4.5, -3
  DrawAxis 3, 2.5

  SetLineColor vbBlue
  x1 = 1.7
  y1 = 0#
  Move x1, y1

  For i = 1 To 100
    T = 2# * Pi / 100 * i
    R = 1.5 * Cos(3# * T) + 0.2
    x2 = R * Cos(T)
    y2 = R * Sin(T)
    DrawLine x1, y1, x2, y2
    x1 = x2
    y1 = y2
  Next i

  SetLineColor vbGreen
  x1 = -2#
  y1 = -2#
  Move x1, y1

  For i = 1 To 100
    x2 = -2# + 4# / 100# * i
    y2 = x2 ^ 3 - 3 * x2
    DrawLine x1, y1, x2, y2
    x1 = x2
    y1 = y2
  Next i

End Sub

Sub DrawAxis(x_max, y_max)

  DrawLine -x_max, 0, x_max, 0
  DrawLine 0, y_max, 0, -y_max

End Sub
