PowerPoint VBA GDI32命令による
ワールド座標グラフィックス描画命令ライブラリの利用例
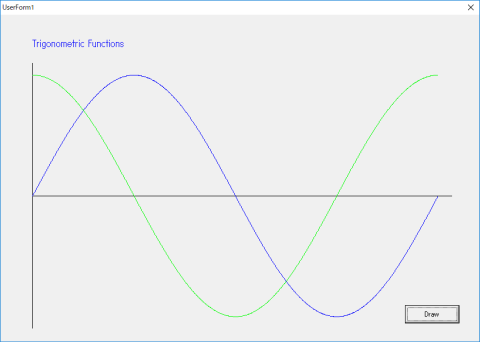
PolyLineを使用した三角関数の表示
AddShape命令を利用したライブラリとは異なり、データ点数が10,000程度でも、ほぼ瞬時に描かれます。
手順の例
- Module2にGDI32命令によるグラフィックス描画命令ライブラリを貼り付けます。
- ユーザーフォームを挿入します。ユーザーフォームのサイズをViewportと同じかそれより大きく設定してください。
- スライドにボタンを挿入し、ダブルクリックしてFormを表示するためのプロシージャを記入します。
Formを表示するためのプロシージャ
Private Sub CommandButton1_Click()
  UserForm1.Show
End Sub
- Formにボタンを挿入します。
- フォームモジュールのCommandButton1_Clickプロシージャに、三角関数を計算し表示するプロシージャに対するCALL命令を記入します。
Form上のボタンをクリックした時に起動されるプロシージャ
Private Sub CommandButton1_Click()
    DrawTrigonometricFunction
End Sub
- フォームモジュールまたはModule1などに、デバイスコンテキストの取得と三角関数を計算し表示するプロシージャを記入します。
デバイスコンテキストの取得とSin, Cos曲線の計算
Sub DrawTrigonometricFunction()
' Get device context handle
    monhdc = GetForegroundWindow()
    myhdc = GetDC(monhdc)
    If myhdc = 0 Then Exit Sub

    Const PI As Single = 3.14159
    Const NP As Long = 1000
    Dim x(NP), y(NP)
    Dim i, nDiv

    nDiv = NP - 1    ' Number of divisions

    InitializeGraphics
'  Specify correspondence between screen coordinates and world coordinates
   SetGraphicsWindow -0.5, 1.5, 7, -1.5
   DrawAxis2 6.5, 1.1        ' Draw axes
   DrawText 0, 1.3, "Trigonometric Functions", vbBlue      ' Draw title

'  Draw Sine function with blue lines
    For i = 0 To nDiv
        x(i + 1) = 2 * PI * i / nDiv
        y(i + 1) = Sin(x(i + 1))
    Next

    SetLineColor (vbBlue)
    DrawPolyLine x, y, NP

 ' Draw Cosine function with greenlines
    For i = 0 To nDiv
        y(i + 1) = Cos(x(i + 1))
    Next

    SetLineColor (vbGreen)
    DrawPolyLine x, y, NP

End Sub

Sub DrawAxis2(x_max, y_max)
    DrawLine 0, 0, x_max, 0
    DrawLine 0, y_max, 0, -y_max
End Sub
実行
- Wordファイルを開きます。自動的にFormが表示されます。
- 三角関数を計算し表示するプロシージャをCALLするボタンをクリックします。
PowerPointファイル glib_ppt-gdi32-03.pptmのダウンロード
ソースプログラム trig-gdi32-eng.basのダウンロード