Excel VBA GDI32命令による
ワールド座標グラフィックス描画命令ライブラリの利用例
基本的なグラフィックス描画機能 - 矩形、楕円、線種
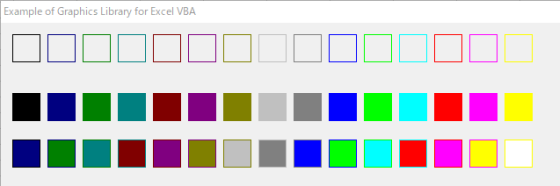
例1 - 色を変えて箱を描く
Sub ColorBox()
Dim c, myBoxSize, myInterval
Dim x1, y1, x2, y2

  monhdc = GetForegroundWindow()
  myhdc = GetDC(monhdc)
  If myhdc = 0 Then Exit Sub

  InitializeGraphics   ' グラフィックス利用の開始宣言

  myBoxSize = 24
  myInterval = myBoxSize + 6
  x1 = 10
  y1 = 10
  For c = 0 To 14
     DrawRectangle x1, y1, x1 + myBoxSize, y1 + myBoxSize, QBColor(c)   ' 箱を描く
     x1 = x1 + myInterval
  Next c
  x1 = 10
  y1 = 60
  For c = 0 To 14
     DrawRectangleFill x1, y1, x1 + myBoxSize, y1 + myBoxSize, QBColor(c)   ' 塗りつぶした箱を描く
     x1 = x1 + myInterval
  Next c
  x1 = 10
  y1 = 100
  For c = 0 To 14
   ' 塗りと線の色が異なる箱を描く
     DrawRectangleFill x1, y1, x1 + myBoxSize, y1 + myBoxSize, QBColor(c), QBColor(c + 1)
     x1 = x1 + myInterval
  Next c

 End Sub
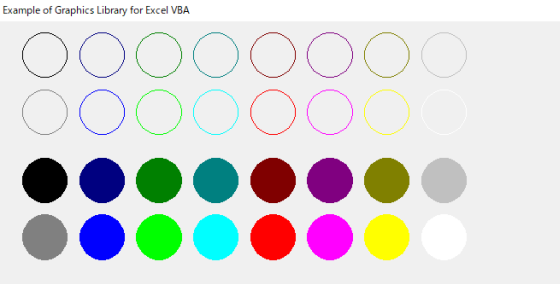
例2 - 色を変えて円を描く
Sub ColorCircle()
  Dim c, r, d
  Dim x, y

  monhdc = GetForegroundWindow()
  myhdc = GetDC(monhdc)
  If myhdc = 0 Then Exit Sub

  r = 20
  d = 50

  InitializeGraphics   ' グラフィックス利用の開始宣言

  gClear   ' 画面消去

  c = 0   ' 色番号の初期化
  For y = 30 To 100 Step d
    For x = 40 To 400 Step d
      DrawOval x, y, r, r, QBColor(c)   ' 円を描く
      c = c + 1
    Next x
  Next y

  c = 0
  For y = 140 To 210 Step d
    For x = 40 To 400 Step d
      DrawOvalFill x, y, r, r, QBColor(c)   ' 塗りつぶした円を描く
      c = c + 1
    Next x
  Next y
End Sub
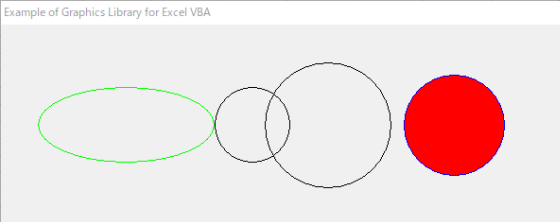
例3 - 楕円を描く
Sub DrawOvalTest()

  monhdc = GetForegroundWindow()
  myhdc = GetDC(monhdc)
  If myhdc = 0 Then Exit Sub

  InitializeGraphics   ' グラフィックス利用の開始宣言
  ' 楕円を描く
  DrawOval 100, 80, 70, 30, vbGreen
  ' 正円を描く
  DrawOval 200, 80, 30, 30, vbBlack
  ' デフォールトによる半径比率と色指定
  DrawOval 260, 80, 50
  ' 塗と線の色のQBColor関数による指定
  DrawOvalFill 360, 80, 40, , QBColor(9), QBColor(12)

End Sub
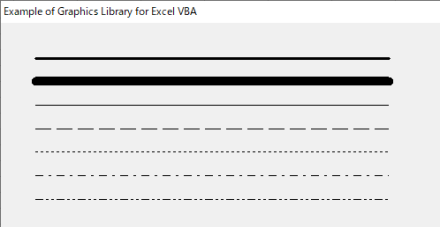
例4 - 線の太さと種類を変える
Sub LineStyleTest()

  Dim c, y
  Const x1 = 30
  Const x2 = 330
  Const d = 20

  monhdc = GetForegroundWindow()
  myhdc = GetDC(monhdc)
  If myhdc = 0 Then Exit Sub

  InitializeGraphics   ' グラフィックス利用の開始宣言

  c = QBColor(0)
  y = 30

  gLineWidth = 3   ' 線の太さ
  DrawLine x1, y, x2, y, c   ' 線を描く

  y = y + d
  gLineWidth = 10   ' 線の太さ
  DrawLine x1, y, x2, y, c   ' 線を描く

  y = y + d
  gLineWidth = 1   ' 線の太さ
  DrawLine x1, y, x2, y, c

 y = y + d
  SetLineStyle PS_DASH
  DrawLine x1, y, x2, y, c

  y = y + d
  SetLineStyle PS_DOT
  DrawLine x1, y, x2, y, c

  y = y + d
  SetLineStyle PS_DASHDOT
  DrawLine x1, y, x2, y, c

  y = y + d
  SetLineStyle PS_DASHDOTDOT
  DrawLine x1, y, x2, y, c

End Sub
Sub ColorBox() Dim c, myBoxSize, myInterval Dim x1, y1, x2, y2 monhdc = GetForegroundWindow() myhdc = GetDC(monhdc) If myhdc = 0 Then Exit Sub InitializeGraphics ' グラフィックス利用の開始宣言 myBoxSize = 24 myInterval = myBoxSize + 6 x1 = 10 y1 = 10 For c = 0 To 14 DrawRectangle x1, y1, x1 + myBoxSize, y1 + myBoxSize, QBColor(c) ' 箱を描く x1 = x1 + myInterval Next c x1 = 10 y1 = 60 For c = 0 To 14 DrawRectangleFill x1, y1, x1 + myBoxSize, y1 + myBoxSize, QBColor(c) ' 塗りつぶした箱を描く x1 = x1 + myInterval Next c x1 = 10 y1 = 100 For c = 0 To 14 ' 塗りと線の色が異なる箱を描く DrawRectangleFill x1, y1, x1 + myBoxSize, y1 + myBoxSize, QBColor(c), QBColor(c + 1) x1 = x1 + myInterval Next c End Sub
Sub ColorCircle() Dim c, r, d Dim x, y monhdc = GetForegroundWindow() myhdc = GetDC(monhdc) If myhdc = 0 Then Exit Sub r = 20 d = 50 InitializeGraphics ' グラフィックス利用の開始宣言 gClear ' 画面消去 c = 0 ' 色番号の初期化 For y = 30 To 100 Step d For x = 40 To 400 Step d DrawOval x, y, r, r, QBColor(c) ' 円を描く c = c + 1 Next x Next y c = 0 For y = 140 To 210 Step d For x = 40 To 400 Step d DrawOvalFill x, y, r, r, QBColor(c) ' 塗りつぶした円を描く c = c + 1 Next x Next y End Sub
例3 - 楕円を描く
Sub DrawOvalTest()
monhdc = GetForegroundWindow()
myhdc = GetDC(monhdc)
If myhdc = 0 Then Exit Sub
InitializeGraphics ' グラフィックス利用の開始宣言
' 楕円を描く
DrawOval 100, 80, 70, 30, vbGreen
' 正円を描く
DrawOval 200, 80, 30, 30, vbBlack
' デフォールトによる半径比率と色指定
DrawOval 260, 80, 50
' 塗と線の色のQBColor関数による指定
DrawOvalFill 360, 80, 40, , QBColor(9), QBColor(12)
End Sub
例4 - 線の太さと種類を変える
Sub LineStyleTest()
Dim c, y
Const x1 = 30
Const x2 = 330
Const d = 20
monhdc = GetForegroundWindow()
myhdc = GetDC(monhdc)
If myhdc = 0 Then Exit Sub
InitializeGraphics ' グラフィックス利用の開始宣言
c = QBColor(0)
y = 30
gLineWidth = 3 ' 線の太さ
DrawLine x1, y, x2, y, c ' 線を描く
y = y + d
gLineWidth = 10 ' 線の太さ
DrawLine x1, y, x2, y, c ' 線を描く
y = y + d
gLineWidth = 1 ' 線の太さ
DrawLine x1, y, x2, y, c
y = y + d
SetLineStyle PS_DASH
DrawLine x1, y, x2, y, c
y = y + d
SetLineStyle PS_DOT
DrawLine x1, y, x2, y, c
y = y + d
SetLineStyle PS_DASHDOT
DrawLine x1, y, x2, y, c
y = y + d
SetLineStyle PS_DASHDOTDOT
DrawLine x1, y, x2, y, c
End Sub
Sub DrawOvalTest() monhdc = GetForegroundWindow() myhdc = GetDC(monhdc) If myhdc = 0 Then Exit Sub InitializeGraphics ' グラフィックス利用の開始宣言 ' 楕円を描く DrawOval 100, 80, 70, 30, vbGreen ' 正円を描く DrawOval 200, 80, 30, 30, vbBlack ' デフォールトによる半径比率と色指定 DrawOval 260, 80, 50 ' 塗と線の色のQBColor関数による指定 DrawOvalFill 360, 80, 40, , QBColor(9), QBColor(12) End Sub
Sub LineStyleTest() Dim c, y Const x1 = 30 Const x2 = 330 Const d = 20 monhdc = GetForegroundWindow() myhdc = GetDC(monhdc) If myhdc = 0 Then Exit Sub InitializeGraphics ' グラフィックス利用の開始宣言 c = QBColor(0) y = 30 gLineWidth = 3 ' 線の太さ DrawLine x1, y, x2, y, c ' 線を描く y = y + d gLineWidth = 10 ' 線の太さ DrawLine x1, y, x2, y, c ' 線を描く y = y + d gLineWidth = 1 ' 線の太さ DrawLine x1, y, x2, y, c y = y + d SetLineStyle PS_DASH DrawLine x1, y, x2, y, c y = y + d SetLineStyle PS_DOT DrawLine x1, y, x2, y, c y = y + d SetLineStyle PS_DASHDOT DrawLine x1, y, x2, y, c y = y + d SetLineStyle PS_DASHDOTDOT DrawLine x1, y, x2, y, c End Sub
![]()
このページの著作権は,木原 寛が保有しています。