Excel VBAによるグラフ描画の例
三角関数の表示
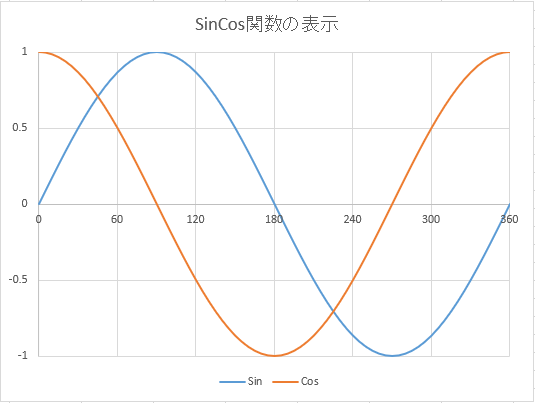
三角関数をExcel VBAのグラフ描画機能を利用して描く例を示します。
Sub SinCos_Curve()

  Dim x As Double
  Dim i As Integer

  x = 0

  For i = 1 To 73
    Cells(i + 1, 1) = x
    Cells(i + 1, 2) = Sin(WorksheetFunction.Radians(x))
    Cells(i + 1, 3) = Cos(WorksheetFunction.Radians(x))
    x = x + 5
  Next i

' 散布図グラフの表示
 ActiveSheet.Shapes.AddChart2(240, xlXYScatterSmoothNoMarkers, , , 400, 300).Select
 ActiveChart.SetSourceData Source:=Range("Sheet1!$A$1:$C$74")
' グラフのタイトル
  ActiveChart.HasTitle = True    ' グラフのタイトルを表示する
  ActiveChart.ChartTitle.Text = "SinCos関数の表示"
 ' X軸の目盛りの設定
  ActiveChart.Axes(xlCategory).Select    ' 横軸を選択
  ActiveChart.Axes(xlCategory).MinimumScale = 0  ' 最小値
  ActiveChart.Axes(xlCategory).MaximumScale = 360  ' 最大値
  ActiveChart.Axes(xlCategory).MajorUnit = 60  ' 主目盛り間隔
' Y軸の目盛りの設定
  ActiveChart.Axes(xlValue).Select    ' 縦軸を選択
  ActiveChart.Axes(xlValue).MinimumScale = -1  ' 最小値
  ActiveChart.Axes(xlValue).MaximumScale = 1  ' 最大値
  ActiveChart.Axes(xlValue).MajorUnit = 0.5    ' 主目盛り間隔

End Sub