基本的なグラフィックス描画機能 − 矩形、楕円、線種
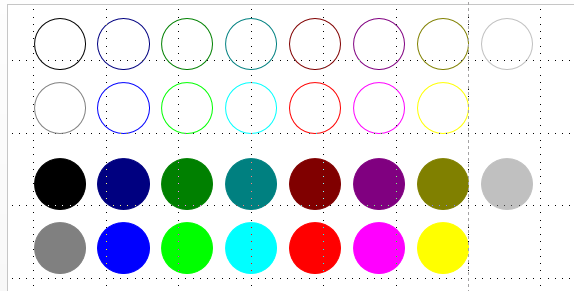
例1 − 色を変えて箱を描く
Sub ColorBox()
Dim c, myBoxSize, myInterval
Dim x1, y1, x2, y2

  InitializeGraphics   ' グラフィックス利用の開始宣言

  myBoxSize = 22
  myInterval = myBoxSize + 5
  x1 = 0
  y1 = 10
  For c = 0 To 14
     DrawRectangle x1, y1, x1 + myBoxSize, y1 + myBoxSize, QBColor(c)   ' 箱を描く
     x1 = x1 + myInterval
  Next c
  x1 = 0
  y1 = y1 + myInterval
  For c = 0 To 14
     DrawRectangleFill x1, y1, x1 + myBoxSize, y1 + myBoxSize, QBColor(c)   ' 塗りつぶした箱を描く
     x1 = x1 + myInterval
  Next c
  x1 = 0
  y1 = y1 + myInterval
  For c = 0 To 14
   ' 塗りと線の色が異なる箱を描く
     DrawRectangleFill x1, y1, x1 + myBoxSize, y1 + myBoxSize, QBColor(c), QBColor(c + 1)
     x1 = x1 + myInterval
  Next c

 End Sub

例2 − 色を変えて円を描く
Sub ColorCircle()
Dim i, j, c, r, d
Dim x, y

  r = 15
  d = 35

  InitializeGraphics   ' グラフィックス利用の開始宣言

  y = 120
  x = 10

  c = 0   ' 色番号の初期化
  For i = 1 To 2
    For j = 1 To 8
      DrawOval x, y, r, r, QBColor(c)   ' 円を描く
      c = c + 1
      x = x + d
    Next j
    y = y + d
    x = 10
  Next i

  c = 0
 For i = 1 To 2
    For j = 1 To 8
      DrawOvalFill x, y, r, r, QBColor(c)   ' 塗りつぶした円を描く
      c = c + 1
      x = x + d
    Next j
    y = y + d
    x = 10
  Next i

End Sub
例3 − 楕円を描く
Sub DrawOvalTest()

  InitializeGraphics   ' グラフィックス利用の開始宣言
  y = 300
  ' 楕円を描く
  DrawOval 70, y, 70, 30, vbGreen
  ' 正円を描く
  DrawOval 190, y, 20, 20, vbBlack
  ' デフォールトによる半径比率と色指定
  DrawOval 240, y, 45
  ' 塗と線の色のQBColor関数による指定
  DrawOvalFill 340, y, 35, , QBColor(9), QBColor(12)

End Sub

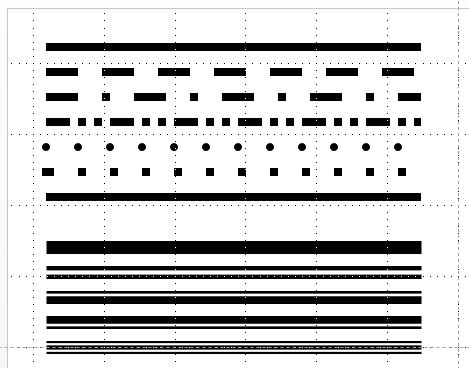
例4 − 線の太さと種類を変える
Sub LineStyleTest()
  Dim c, y
  Const x1 = 10
  Const x2 = 310
  Const d = 18

  InitializeGraphics   ' グラフィックス利用の開始宣言

  gLineWidth = 6#   ' 線の太さ
  c = QBColor(0)
  y = 360
  DrawLine x1, y, x2, y, c   ' 線を描く

  y = y + d
  SetDashStyle msoLineDash   ' 線種の指定
  DrawLine x1, y, x2, y, c

  y = y + d
  SetDashStyle msoLineDashDot
  DrawLine x1, y, x2, y, c

  y = y + d
  SetDashStyle msoLineDashDotDot
  DrawLine x1, y, x2, y, c

  y = y + d
  SetDashStyle msoLineRoundDot
  DrawLine x1, y, x2, y, c

  y = y + d
  SetDashStyle msoLineSquareDot
  DrawLine x1, y, x2, y, c

  y = y + d
  SetDashStyle msoLineSolid   ' 線種の指定 実線
  DrawLine x1, y, x2, y, c

  gLineWidth = 10#   ' 線の太さ
  y = y + d * 2
  SetLineStyle msoLineSingle
  DrawLine x1, y, x2, y, c

  y = y + d
  SetLineStyle msoLineThinThin
  DrawLine x1, y, x2, y, c

  y = y + d
  SetLineStyle msoLineThinThick
  DrawLine x1, y, x2, y, c

  y = y + d
  SetLineStyle msoLineThickThin
  DrawLine x1, y, x2, y, c

  y = y + d
  SetLineStyle msoLineThickBetweenThin
  DrawLine x1, y, x2, y, c
End Sub
Sub ColorBox() Dim c, myBoxSize, myInterval Dim x1, y1, x2, y2 InitializeGraphics ' グラフィックス利用の開始宣言 myBoxSize = 22 myInterval = myBoxSize + 5 x1 = 0 y1 = 10 For c = 0 To 14 DrawRectangle x1, y1, x1 + myBoxSize, y1 + myBoxSize, QBColor(c) ' 箱を描く x1 = x1 + myInterval Next c x1 = 0 y1 = y1 + myInterval For c = 0 To 14 DrawRectangleFill x1, y1, x1 + myBoxSize, y1 + myBoxSize, QBColor(c) ' 塗りつぶした箱を描く x1 = x1 + myInterval Next c x1 = 0 y1 = y1 + myInterval For c = 0 To 14 ' 塗りと線の色が異なる箱を描く DrawRectangleFill x1, y1, x1 + myBoxSize, y1 + myBoxSize, QBColor(c), QBColor(c + 1) x1 = x1 + myInterval Next c End Sub
Sub ColorCircle() Dim i, j, c, r, d Dim x, y r = 15 d = 35 InitializeGraphics ' グラフィックス利用の開始宣言 y = 120 x = 10 c = 0 ' 色番号の初期化 For i = 1 To 2 For j = 1 To 8 DrawOval x, y, r, r, QBColor(c) ' 円を描く c = c + 1 x = x + d Next j y = y + d x = 10 Next i c = 0 For i = 1 To 2 For j = 1 To 8 DrawOvalFill x, y, r, r, QBColor(c) ' 塗りつぶした円を描く c = c + 1 x = x + d Next j y = y + d x = 10 Next i End Sub
例3 − 楕円を描く
Sub DrawOvalTest()
InitializeGraphics ' グラフィックス利用の開始宣言
y = 300
' 楕円を描く
DrawOval 70, y, 70, 30, vbGreen
' 正円を描く
DrawOval 190, y, 20, 20, vbBlack
' デフォールトによる半径比率と色指定
DrawOval 240, y, 45
' 塗と線の色のQBColor関数による指定
DrawOvalFill 340, y, 35, , QBColor(9), QBColor(12)
End Sub
例4 − 線の太さと種類を変える
Sub LineStyleTest()
Dim c, y
Const x1 = 10
Const x2 = 310
Const d = 18
InitializeGraphics ' グラフィックス利用の開始宣言
gLineWidth = 6# ' 線の太さ
c = QBColor(0)
y = 360
DrawLine x1, y, x2, y, c ' 線を描く
y = y + d
SetDashStyle msoLineDash ' 線種の指定
DrawLine x1, y, x2, y, c
y = y + d
SetDashStyle msoLineDashDot
DrawLine x1, y, x2, y, c
y = y + d
SetDashStyle msoLineDashDotDot
DrawLine x1, y, x2, y, c
y = y + d
SetDashStyle msoLineRoundDot
DrawLine x1, y, x2, y, c
y = y + d
SetDashStyle msoLineSquareDot
DrawLine x1, y, x2, y, c
y = y + d
SetDashStyle msoLineSolid ' 線種の指定 実線
DrawLine x1, y, x2, y, c
gLineWidth = 10# ' 線の太さ
y = y + d * 2
SetLineStyle msoLineSingle
DrawLine x1, y, x2, y, c
y = y + d
SetLineStyle msoLineThinThin
DrawLine x1, y, x2, y, c
y = y + d
SetLineStyle msoLineThinThick
DrawLine x1, y, x2, y, c
y = y + d
SetLineStyle msoLineThickThin
DrawLine x1, y, x2, y, c
y = y + d
SetLineStyle msoLineThickBetweenThin
DrawLine x1, y, x2, y, c
End Sub
Sub DrawOvalTest() InitializeGraphics ' グラフィックス利用の開始宣言 y = 300 ' 楕円を描く DrawOval 70, y, 70, 30, vbGreen ' 正円を描く DrawOval 190, y, 20, 20, vbBlack ' デフォールトによる半径比率と色指定 DrawOval 240, y, 45 ' 塗と線の色のQBColor関数による指定 DrawOvalFill 340, y, 35, , QBColor(9), QBColor(12) End Sub
Sub LineStyleTest() Dim c, y Const x1 = 10 Const x2 = 310 Const d = 18 InitializeGraphics ' グラフィックス利用の開始宣言 gLineWidth = 6# ' 線の太さ c = QBColor(0) y = 360 DrawLine x1, y, x2, y, c ' 線を描く y = y + d SetDashStyle msoLineDash ' 線種の指定 DrawLine x1, y, x2, y, c y = y + d SetDashStyle msoLineDashDot DrawLine x1, y, x2, y, c y = y + d SetDashStyle msoLineDashDotDot DrawLine x1, y, x2, y, c y = y + d SetDashStyle msoLineRoundDot DrawLine x1, y, x2, y, c y = y + d SetDashStyle msoLineSquareDot DrawLine x1, y, x2, y, c y = y + d SetDashStyle msoLineSolid ' 線種の指定 実線 DrawLine x1, y, x2, y, c gLineWidth = 10# ' 線の太さ y = y + d * 2 SetLineStyle msoLineSingle DrawLine x1, y, x2, y, c y = y + d SetLineStyle msoLineThinThin DrawLine x1, y, x2, y, c y = y + d SetLineStyle msoLineThinThick DrawLine x1, y, x2, y, c y = y + d SetLineStyle msoLineThickThin DrawLine x1, y, x2, y, c y = y + d SetLineStyle msoLineThickBetweenThin DrawLine x1, y, x2, y, c End Sub
![]()
このページの著作権は,木原 寛が保有しています。